Get Your Brain Together Hackathons
Back to the Tutorials List
Visualization for Registration and Image Data
Instructors
- Brianna Major (Kitware)
- Paul Elliott (Kitware)
Tutorial Description
What does a 3D image look like? How did the image change after processing? Can I share my images with others?
Using itkwidgets, we will demo how to explore images in different data formats.
Duration: 0.5 hours.
Learning Outcomes
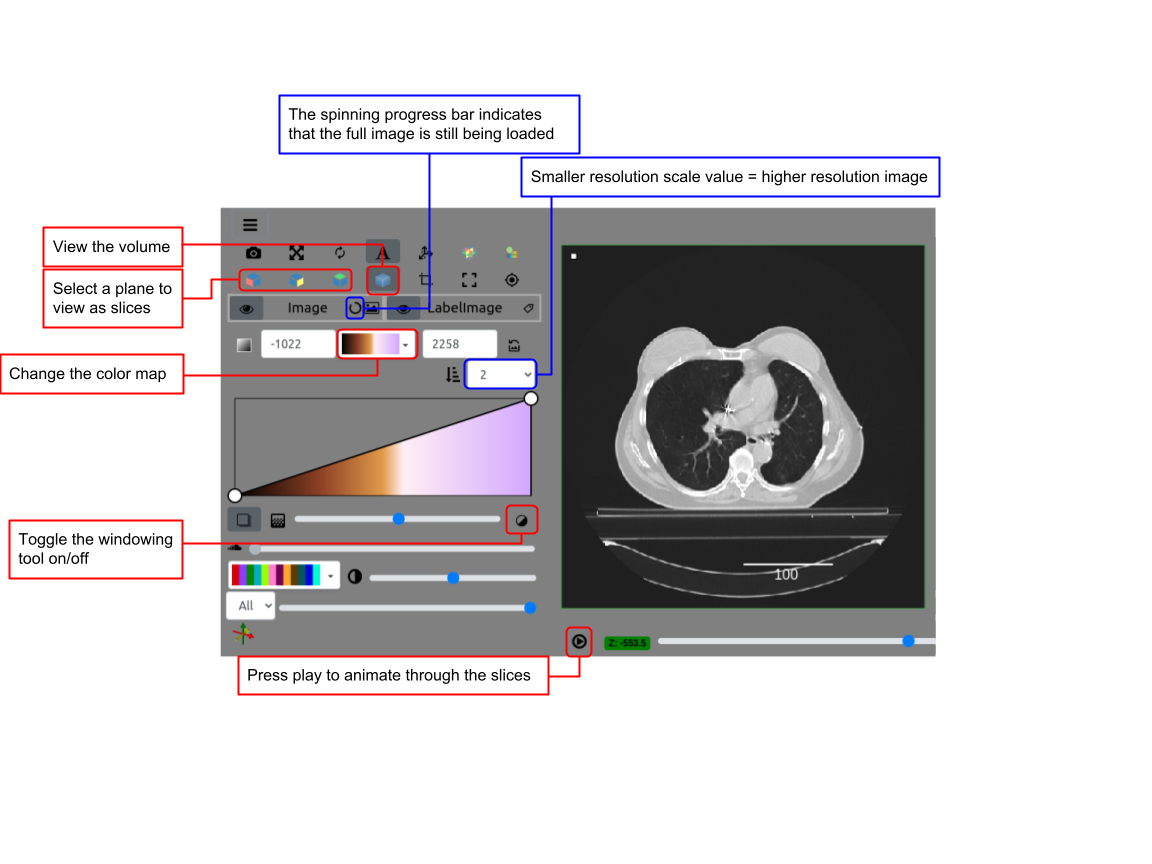
- Display 3D images in Jupyter Notebooks and on a web page.
- Navigation around multi-component images in the 3D view and with 2D slices.
- Adjust rendering parameters: color maps, color ranges, opacity transfer functions and the gradient opacity factor.
- Visualize a “label map” on a image.
- Combine 2 images to compare registration results.
Approach and Materials
- Hello itkwidgets notebook
- Label map notebook
- Compare images notebook
- Web viewer <- itk-vtk-viewer